2016 Chicago Auto Thefts
There is no worse feeling than walking to where your car was last parked and it isn't there. Was it towed? Was it stolen? Did you just forget? At Illinois Vehicle we've taken historical Chicago Police Department data1 from the past 10 years (2007-2016) and broken out the total number of vehicle thefts in each of Chicago's 77 community areas, with a focus on auto thefts in 2016.
Quick Facts
Roughly 12% of Chicago households do not own a vehicle2
Overwhelming majority of vehicles stolen while parked on public street (73% in 2016)
Austin by far and away has the most stolen vehicles of all communities in Chicago
Unattended vehicles at gas stations present car thieves an excellent opportunity
Overall Trends
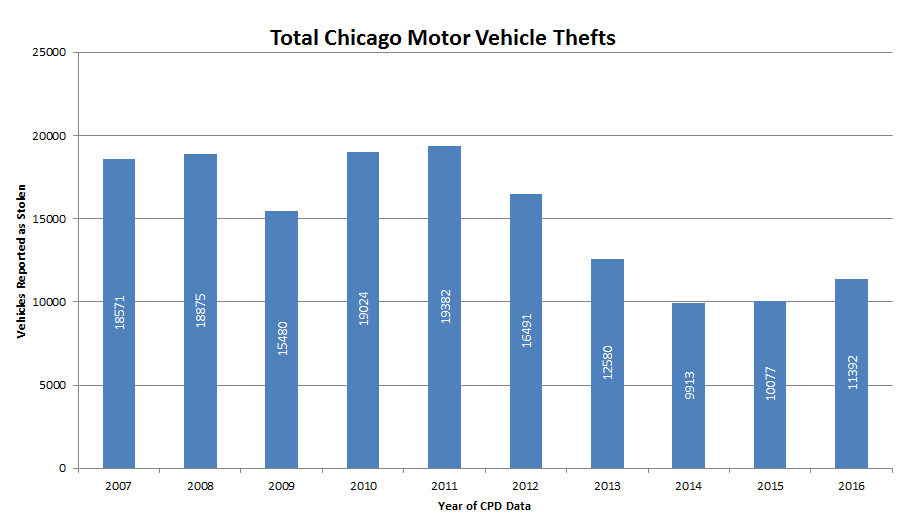
2016 saw a 13% increase in the number of reported auto thefts in Chicago when compared to 2015, but compared against 2007 overall motor vehicle thefts in Chicago have decreased by 39%. The largest contributing factors to this decline, which is mirrored on a national level, are significant improvements in vehicle anti-theft technologies. Technologies such as ignitions that require activation by smart keys and alarm systems capable of disabling a vehicle make vehicle theft infinitely more difficult for would be thieves. Despite the numbers provided by the Chicago Police Department, the overall Chicago Metropolitan Statistical Area ranks 129th in motor vehicle thefts per capita per NICB's 2015 reporting.
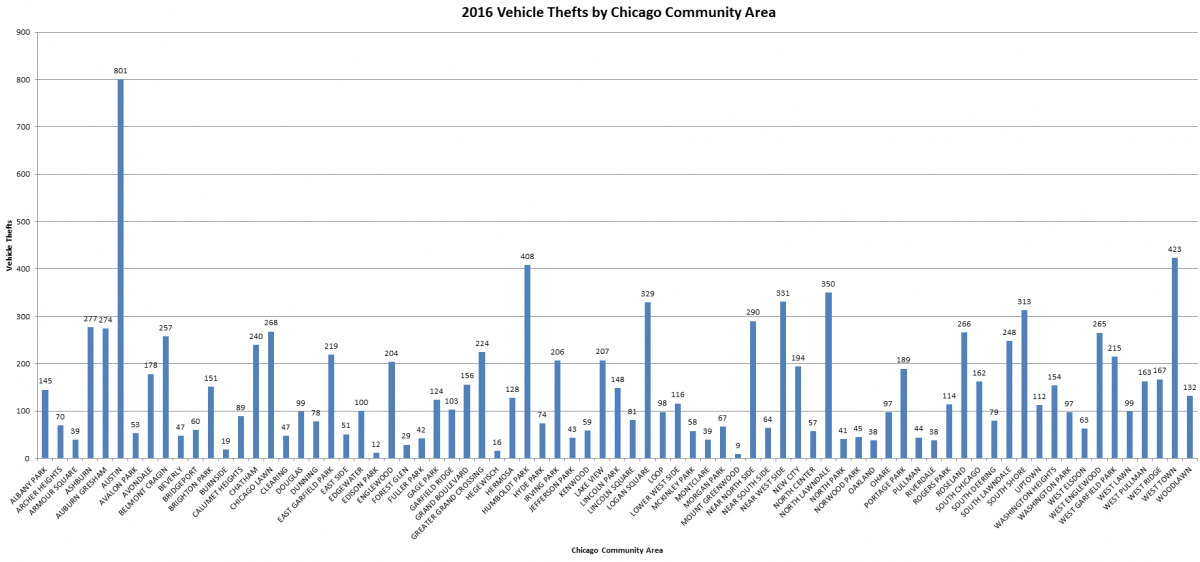
2016 Vehicle Thefts by Neighborhoods (Click to Enlarge)
Motor vehicle thefts are most heavily concentrated in less affluent western parts of Chicago such as Austin, Humboldt Park, Lawndale and Garfield Park. Southwestern communities such as Englewood, South Shore, Auburn Gresham and Chatham are also well represented. 2016 saw a drastic increase (139%) for auto thefts in Ashburn, which is directly adjacent to the aforementioned southwestern communities.
The below graph shows Austin is by far Chicago's vehicle theft capital, with 801 total thefts, almost as many as the next two communities of West Town (423 thefts) and Humboldt Park (408 thefts) combined.
Neighborhoods with Most Auto Thefts in 2016
The top neighborhoods for auto thefts are also neighborhoods that tend to experience higher levels of other crimes. Below are the neighborhoods and the number of reported motor vehicle thefts for 2016.
Austin - 801
West Town - 423
Humboldt Park - 408
North Lawndale - 350
Near West Side - 331
Neighborhoods with Least Number of Auto Thefts in 2016
The neighborhoods with the least number of auto thefts tend to be more affluent and have smaller overall populations, with none of these communities having more than 20,000 residents.
Mount Greenwood - 9
Edison Park - 12
Hegewisch - 16
Burnside - 19
Forest Glen - 29
Largest Annual (2016 vs. 2015) Percentage Increase
The award for the highest annual growth in motor vehicle thefts goes to the southwestern community of Ashburn. Ashburn recorded the most auto thefts in over a decade with 277 vehicles stolen, bringing the total number of vehicles stolen closer to the neighboring communities of Chicago Lawn (268 thefts) to the north and Auburn Gresham (274 thefts) to the east. O'Hare comes in second, with a 111% increase, with over 83% of reported thefts occuring within the confines of airport parking lots or garages.
Ashburn - 139% (277 vs 116)
O'Hare - 111% (97 vs 46)
Beverly - 96% (47 vs 24)
Forest Glen - 93% (29 vs 15)
Near North Side - 90% (290 vs 153)
Largest Annual (2016 vs. 2015) Percentage Decrease
The three communities with the largest decreases are a small band along the Chicago River and Interstate 55. Neighborhoods to both the north and south have experienced growth in auto thefts, while Bridgeport, Armour Square and Lower West side have all experienced a combined 108 fewer auto thefts in 2016 when compared to 2015.
Bridgeport - -38% (60 vs 97)
Armour Square - -35% (39 vs 60)
Lower West Side - -30% (116 vs 166)
Uptown - -28% (112 vs 155)
Burnside - -21% (19 vs 24)
2016 Where Vehicles are Stolen From
Over 95% of vehicles stolen in 2016 were unattended. Over 250 vehicles were stolen at gas stations, likely aided by drivers leaving the vehicle running while going inside the store-- the perfect opportunity for a would be auto thief.
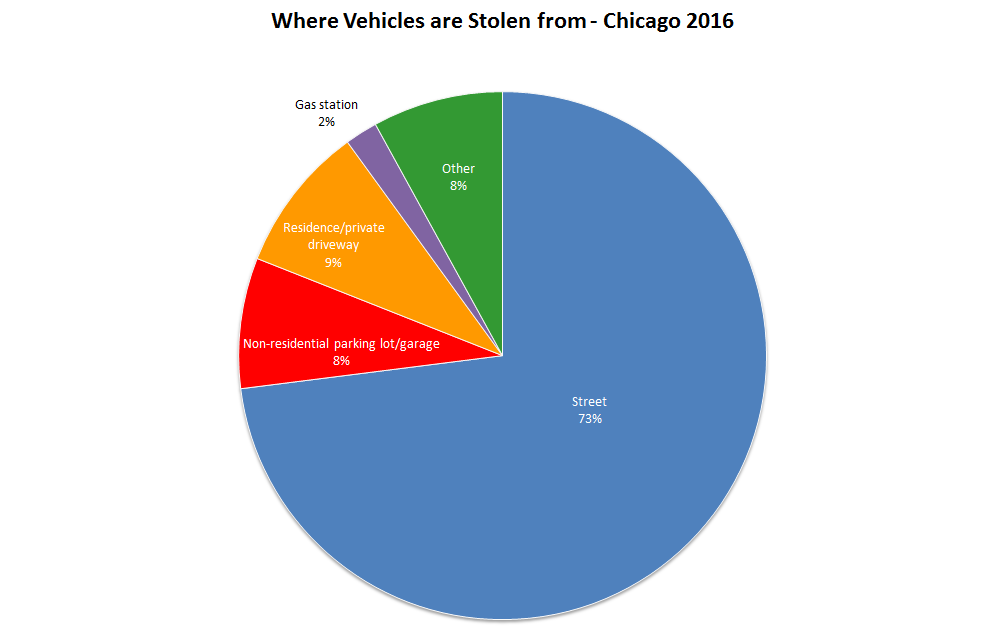
Street - 73%
Residence/private driveway - 9%
Non-residential parking lot/garage - 8%
Gas station - 2% (most of which were unattended)
Other - 8%
Sources
2https://www.cmap.illinois.gov/documents/10180/27573/Vehicle_Availability...
3Illinois Vehicle Manipulated Data Spreadsheet